
A pathway-specific measurement strategy for recovery after health-system disruption
Key takeaways
- Recovery cannot be inferred from reopened facilities or restored service volumes alone; new and disrupted patient cohorts require separate follow-up.
- The Care Recovery Clock defines dated service and care milestones, explicitly tracks untraced and adverse outcomes, and supplements its signed temporal gap with capacity-adjusted accumulated waiting.
- All numerical examples are fictional. Real linked service and patient data are required to assess validity and incremental managerial usefulness.
Research status: This article proposes a measurement strategy and demonstrates its calculations using entirely fictional patient and service records. It does not report an empirical clinical study or an independently validated health-system indicator.
Abstract
Health services can resume operations before patients whose care was disrupted have received it. The Care Recovery Clock is a pathway-specific measurement strategy that dates three milestones after a disruption: sustained service capability (tS), timely care for newly eligible patients (tF), and verified resolution within a frozen register of displaced patients (tB). Care-criterion attainment is tC=max(tF,tB), and the signed Care Recovery Gap is tC−tS. Each milestone requires sustained attainment confirmed on the records as known at the confirmation date; untraced and adverse outcomes are reported and never counted as recovery. A complementary measure compares observed waiting with a work-conserving, capacity-feasible benchmark. In a reproducible fictional example with identical offered appointments, the Care Recovery Gap is +8 weeks at baseline and +11 weeks when ten traced patients’ care is deferred, adding 36 patient-weeks of waiting. Capacity-adjusted excess waiting is 77 and 113 patient-weeks respectively, mostly among patients outside the shock-attributable register. When four closures are reopened, the confirmation rule moves the register milestone from week 12 to week 17 instead of declaring recovery prematurely. These results test calculation rules only; real-world value depends on linked service and patient records and on independent validation.
Introduction
A health system can resume service and still leave patients without the care that disruption postponed. This is not a new observation. In a systematic review of 68 studies from high-income countries, Fleming and colleagues found that only 22% assessed the recovery-and-learning stage of resilience [1]. Cross-country COVID-19 research also documented substantial interruptions to routine services [2]. The managerial problem is more specific: how should leaders date recovery when the operational pathway and the patients who depend on it return at different speeds?
This distinction is consequential where crisis, displacement or weak registries impede tracing patients after services reopen; registered-cohort recovery cannot be equated with population recovery.
Earlier scholarship provides the foundations. Bruneau and colleagues modelled restoration of functionality over time [3]; Cimellaro and colleagues applied waiting-time models to hospitals [4]. Radcliff and colleagues measured post-disaster recovery as the change in median business days to complete clinic-cancelled appointments, alongside appointment-completion proportions [5]. The OECD addresses resumption of elective activity and backlog clearance [6], while Jerjes and Majeed distinguish clinical resolution from mere contact [7]. Cumulative queue length also represents accumulated waiting [8]. We do not claim these insights as new. The proposed contribution combines pathway-specific service and patient recovery dates; a bounded register incorporating missed deadlines and never-rebooked patients; explicit ascertainment uncertainty; and confirmation rules that accommodate clinical corrections and reopening.
Two clocks and one derived interval
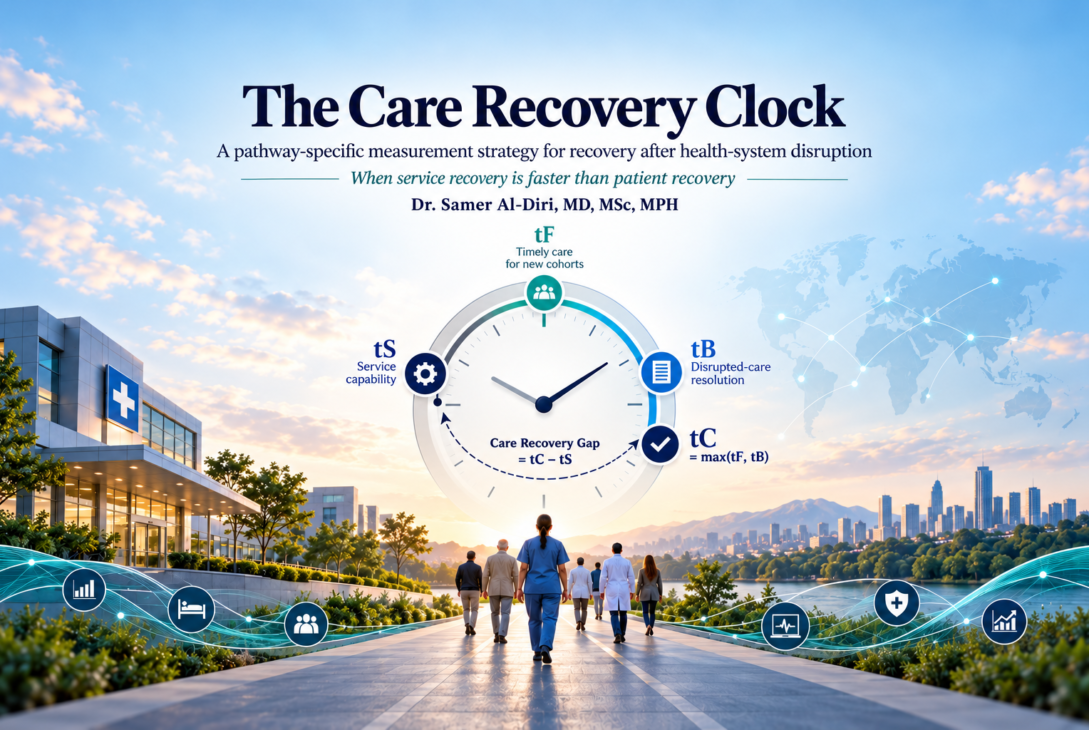
For scheduled, preventive and time-sensitive pathways, prespecify disruption onset t₀, geography, eligibility, clinical windows, thresholds, administrative horizon H and k consecutive qualifying periods. The Service Clock (tS) begins with sustained safe operational readiness and a minimum realised-delivery standard. Delivered documented actions or clinically justified benign closures (A/B below) are compared with incoming eligible demand; appointment offers are recorded separately. The incoming Care Clock (tF) dates the first k entry cohorts reaching a prespecified timely-care threshold. The disrupted Care Clock (tB) dates the first k consecutive periods meeting the verified-resolution threshold for a frozen displaced-patient register, subject to continued attainment until confirmation.
Dates of attainment and confirmation are reported separately: tS after the qualifying periods, tF once corresponding clinical windows mature, and tB following register closure, its sustained run and an audit lag. When observed, tC=max(tF,tB) and the signed Care Recovery Gap is CRG=tC−tS. Report time to service recovery and time to care recovery alongside CRG: delaying a service declaration should never appear to improve recovery. Unreached milestones are reported as censored. Care recovery here means documented indicated action or clinically justified resolution, not demonstrated health gain.
The initial displaced register includes patients with care pending, but not overdue, at t₀. Newly eligible patients missing a deadline before the register closes are transferred into it without being removed from their original timeliness denominator. The register closes when tF is confirmed, or at H if it is not. Pre-shock overdue patients and patients becoming overdue after closure remain separate, reported groups. If tF remains unconfirmed, tB may be calculated for the bounded register while tC and CRG remain censored.
Sustained safe readiness and demonstrated ability to deliver care.
Operational milestoneNewly eligible patients receive clinically indicated care within agreed windows.
Patient milestoneThe frozen displaced-patient register reaches sustained, verified resolution.
Patient milestoneThe later of the two patient milestones: max(tF, tB).
Derived care dateWhat counts as patient recovery?
Each episode has one dated state: (A) indicated action completed; (B) benign closure with documented clinical justification; (C) adverse outcome, progression or death; (D) traced, awaiting care; or (E) untraced, outcome unknown. A/B count as verified resolution; C and D never count as recovery. For N=A+B+C+D+E, the lower ascertainment bound is (A+B)/N and its deliberately optimistic bound is (A+B+E)/N. These are missing-status bounds, not sampling confidence intervals. All adverse outcomes require separate review.
Because episodes can move from untraced to traced, and closures may be corrected or reopened, the protocol records both when a status applied and when it entered the record [9]. A back-dated correction takes effect only from its recording date for real-time declarations. A genuinely reopened episode returns to awaiting care; new clinical need after valid closure starts a new episode. The tB sustained criterion must still hold on records knowable at confirmation. Later corrections or reversals are disclosed with the revised retrospective date, not silently rewritten.
Thresholds, sustained periods and data-maturity rules must be justified and fixed in advance. A pathway-wide registered-cohort declaration also requires assessment of predeclared priority groups and adequate outcome ascertainment. Reporting states are: operations unrestored; operations restored but care unverified; provisional care criteria attained; and registered-cohort care recovery confirmed. People absent from every register remain unmeasured: registered-cohort results cannot establish population-wide recovery.
A reproducible synthetic test
A reproducible fictional test uses 517 episodes per scenario: 80 pending at disruption, 12 already overdue and 425 newly eligible (25 per week for 17 weeks). Illustrative criteria are 90% readiness, delivered activity ≥85% of incoming demand, and ≥90% timely incoming care and displaced-register resolution, with k=2 and a one-week audit lag. The transient operational readiness pass at week 2 fails persistence. Thus tS=4 (confirmed week 5); cohorts entering in weeks 6–7 each achieve 24/25 timely actions, giving tF=6 (confirmed week 9). The frozen register contains 100 patients (80 initial and 20 missed-deadline transfers); nine subsequently overdue patients remain on a separate list.
At week 12 the register records A=90, B=3, C=2, D=0 and E=5, giving ascertainment bounds of 93–98%. Sustained qualification gives tB=tC=12 (confirmed week 14) and CRG=+8 weeks. The rural subgroup (n=20) remains at 80–90%, with both adverse outcomes concentrated there; pathway-wide registered-cohort recovery cannot be declared. In a second constructed scenario with identical appointment offers, ten traced patients’ completions are moved from weeks 10–12 to weeks 14–15. Then tB=15 (confirmed week 17), CRG=+11 weeks, and the shifted episodes contribute 36 additional patient-weeks waiting. No causal mechanism or clinical benefit is inferred.
Confirmation stress tests reopen four week-12 clinical closures in week 13, dropping verified resolution from 93% to 89%. The corrected sustained rule dates tB at week 17 (confirmed week 19), rather than prematurely confirming week 12. Back-dated coding corrections recorded during the confirmation window similarly prevent early declaration; later-recorded corrections preserve the historical declaration while separately reporting its revision. Genuine new episodes after valid closure do not retrospectively alter the frozen register.
| Illustrative measure | Baseline scenario | Delayed-booking scenario |
|---|---|---|
| Service recovery (tS) | Week 4 | Week 4 |
| Incoming-cohort recovery (tF) | Week 6 | Week 6 |
| Disrupted-register recovery (tB) | Week 12 | Week 15 |
| Care Recovery Gap | +8 weeks | +11 weeks |
| Capacity-adjusted excess waiting, weeks 10–16 | 77 patient-weeks | 113 patient-weeks |
All numbers are synthetic and illustrative; no real patient outcomes or healthcare service performance are reported.
From the gap to a management decision
Repeated observations of Tanahashi’s coverage cascade can identify where recovery stalls [10]. The Service Clock reflects capability and delivered activity; the Care Clock concerns documented indicated actions, not health gain [11]. Candidate explanations for divergence include insufficient catch-up throughput, damaged referrals, displaced or untraced patients and changing bottlenecks. Observing a gap alone does not identify a cause.
A complementary opportunity estimate compares observed patient waiting with a work-conserving capacity benchmark. Starting after register closure, offered slots less timely new-patient actions are hypothetically assigned to traced waiting patients across the displaced register, pre-shock overdue group and later overdue group. Untraced patients receive no hypothetical slot; adverse outcomes are not presumed avoidable. The sum of observed minus benchmark waiting over the horizon gives capacity-adjusted excess patient-weeks [8]. This depends on prespecified clinical eligibility and slot compatibility.
Over weeks 10–16 the fictional excess is 77 patient-weeks at baseline and 113 after deferred booking, a 36-week difference. In the register-first allocation, only six of 77 baseline excess patient-weeks arise in the frozen register; 54 arise among patients already overdue before disruption and 17 among later-overdue patients. Both scenarios leave 38 eligible offers unused. Register-only recovery-date residuals depend on hypothetical priority (baseline 0 or −1 weeks; delayed +3 or +2), although the between-scenario difference remains three weeks. Thus a single residual date must not be interpreted as an allocation-invariant measure.
These are capacity-opportunity estimates, not clinical counterfactuals or evidence of avoidable harm. They assume compatible, attended, single-action appointments; real pathways differ by urgency, geography and step. Consequently, CRG remains the primary temporal diagnostic, with excess patient-weeks indicating accumulated waiting under explicitly tested capacity assumptions.
England’s diabetic-eye-screening uptake fell from approximately 82% before COVID-19 to 68% in 2020–21 and returned to 78% in 2021–22 [12]. Such aggregate evidence motivates measurement but cannot date the proposed clocks without linked records. WHO, OECD and Sendai reporting offer complementary policy frameworks [6,13–16].
Baseline scenario
Service week 4 · New cohort week 6 · Disrupted register week 12
Delayed-booking scenario
Service week 4 · New cohort week 6 · Disrupted register week 15
Both scenarios have the same fictional offered appointment capacity; ten traced patients’ completed actions are deferred in the second scenario.
Numbers are capacity-adjusted excess patient-weeks, conditional on hypothetical slot suitability, attendance and allocation. They are not observed avoidable harm or causal effects.
A registered-cohort aggregate meeting an illustrative threshold does not establish pathway-wide recovery where a predeclared priority subgroup remains unconfirmed.
Validation and conclusion
A real-data pilot must draw service readiness and offered appointments from operational systems independently of linked clinical episode histories; classify slot suitability by clinical need, geography and time; and retain both valid and recorded status dates. Prespecify and vary thresholds, periods, priority rules, ascertainment bounds and capacity assumptions. Compare CRG and excess waiting with established queue, backlog and disaster-recovery indicators [5,6]. Competing events, repeated shocks, unregistered populations and small subgroups are major feasibility threats. A long gap alone does not prove disengagement, poor access or preventable harm.
The empirical evaluation should predefine three tests: whether different analysts recover sufficiently similar milestone dates from the same records; whether the Care Recovery Gap adds predictive or decision-relevant information beyond backlog size, waiting-list age and throughput; and whether managers given the new indicators make better allocation decisions than managers given conventional dashboards. Persistent irreproducibility, low ascertainment or absence of incremental value would argue against adoption.
This proposal is specified and computationally tested using invented data. Its value will depend on reliability in independent patient and service records, incremental information beyond current measures, and evidence that its use improves management decisions. If it adds no useful decision information, the method should be revised or abandoned.
References
Publication transparency: This article presents a proposed conceptual framework supported by a fictional computational demonstration. AI-assisted tools supported editorial drafting, synthetic-data coding and illustrative graphics. Dr. Samer Al-Diri critically reviewed and approved the framework, analyses, references and interpretations and accepts full responsibility for the published content.
Suggested citation: Al-Diri S. The Care Recovery Clock: A pathway-specific measurement strategy for recovery after health-system disruption. DrSamerAlDiri.com. 20 October 2026. Available from this article’s permanent URL.
Zenodo research archive: https://doi.org/10.5281/zenodo.23506852
Open Access and Licensing: © 2026 Dr. Samer Al-Diri. This article is published under the Creative Commons Attribution–NonCommercial 4.0 International (CC BY-NC 4.0) licence. Everyone may freely read, download and share this article, with appropriate attribution. Non-commercial adaptation is also permitted under the licence terms. Commercial use requires prior written permission from the author.