
Executive abstract
Health systems commonly manage delay as an operational quantity: days on a waiting list, referrals awaiting action, or the proportion of patients seen within a target. Clinical risk does not mature according to those administrative categories. It develops within condition-specific windows during which life, function or independence may still be preserved. This article introduces prevention liability: the accumulating future clinical, financial, workforce, family, social-care and trust burden created when manageable risk remains unresolved until recoverability is diminished or lost. The concept is intended for strategic decision support; it is neither a recognised legal liability, an accounting standard nor a universal costing formula. Drawing on global quality-of-care evidence, regional economic estimates and four eye-care tracers across the life course – retinopathy of prematurity, amblyopia, diabetic retinopathy and age-related macular degeneration – the analysis explains why activity, coverage and waiting-time measures can appear reassuring while clinically important exposure continues to age inside the system. It proposes clinical-window governance and a board-level Prevention Liability Register to identify unresolved risk, assign end-to-end ownership, trigger escalation before important thresholds are crossed, make inequity visible and verify pathway closure. This is an evidence-based executive alert, not an exercise in alarmism. It does not claim that every delay causes harm or that all downstream disease burden is attributable to delayed care. The argument is narrower and more practical: leaders need a more discriminating view of time, one that separates ordinary operational backlog from the silent consumption of recoverable health.
Key messages for decision-makers
1. The queue that conceals harm
Waiting lists are indispensable operational instruments. They reveal demand, capacity constraints and service pressure. Their apparent precision, however, can create the impression that time is a uniform commodity. A thirty-day wait for one condition may be inconvenient yet clinically recoverable; for another patient, the same interval may remove a treatment option, compromise development, permit avoidable progression or turn independent living into dependency. To the patient and family, that distinction is not administrative: it may determine whether the next encounter still offers protection or records a loss that can no longer be recovered. The interval is the same. Its consequence is not.
This distinction matters because health systems increasingly govern through aggregated indicators: mean waits, median waits, percentages within target, clinic utilisation and throughput. These measures are necessary, but they compress several clinically decisive questions. When did the relevant risk begin? How quickly does recoverability diminish? Where did the patient leave the intended pathway? Who was accountable at that point? Was the patient merely referred, or was the required intervention completed and its outcome confirmed?
WHO estimates that poor-quality care is associated with 5.7-8.4 million deaths each year in low- and middle-income countries, equivalent to as much as 15% of deaths in those settings. It also estimates annual productivity losses of US$1.4-1.6 trillion linked to inadequate quality. These are broad quality-of-care estimates, not delay-only estimates. Their significance here is that timeliness is one of the recognised dimensions of quality, and that apparently modest failures of process can aggregate into mortality, disability and economic loss at system scale. (WHO, 2025)
Healthcare organisations operate in calendar time. Disease progresses in biological time. Clinical-window governance is the discipline required to reconcile the two.
The central management problem is therefore not delay in the abstract. It is unresolved, time-sensitive risk. A mature system must distinguish delay that is tolerable, delay that requires mitigation, and delay that is actively consuming the possibility of recovery. Without that distinction, organisations may optimise the average queue while failing the patient whose window is shortest.
2. Defining prevention liability
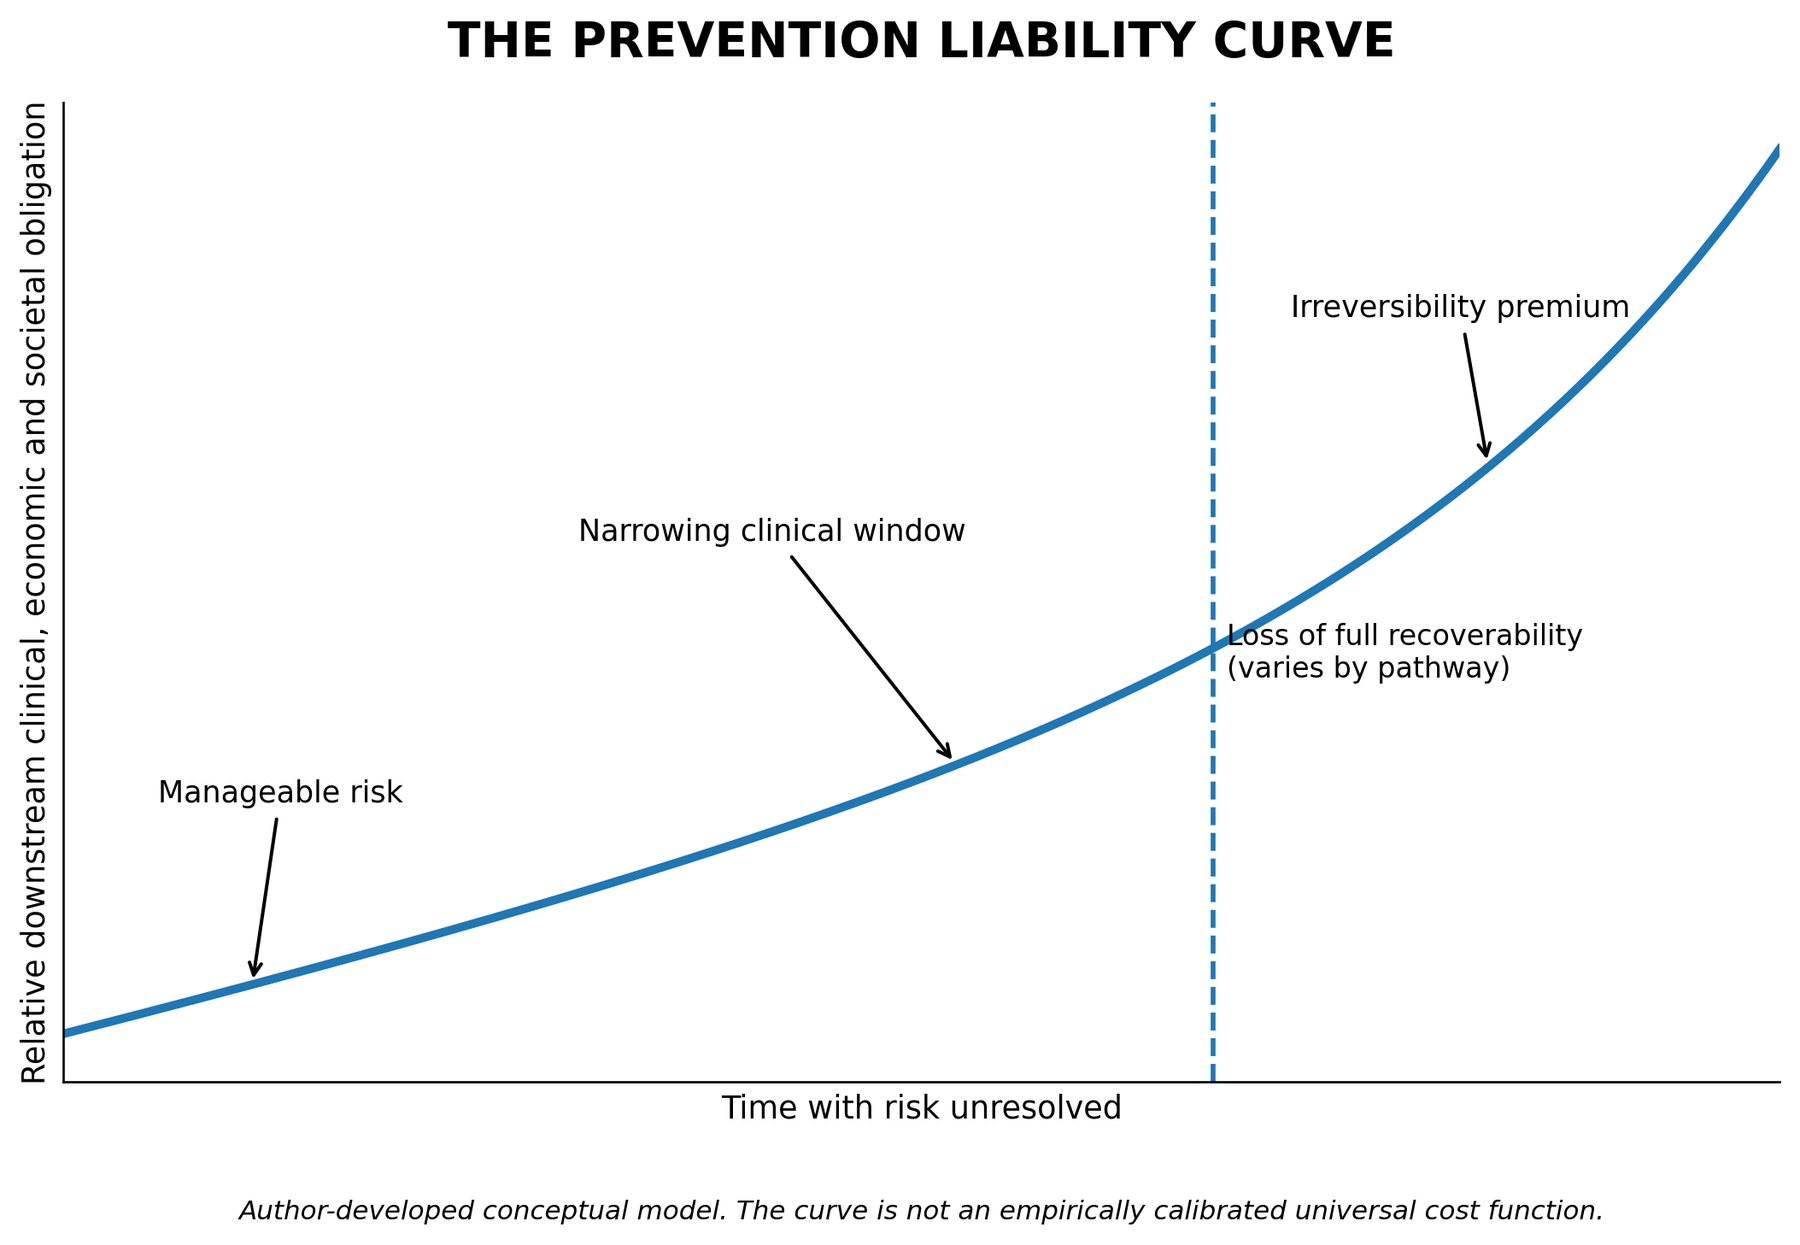
Prevention liability is defined here as the accumulating future clinical, financial and societal obligation created when a preventable, detectable or treatable risk remains unresolved as the relevant clinical window narrows. The integrated health-system construct is author-developed for this analysis. The term is not used to imply legal negligence, a provision that must appear on a financial balance sheet, or a scientifically validated universal method of monetising harm.
The construct is intentionally wider than the direct cost of treatment. Its purpose is to make visible a burden that is frequently distributed across separate budgets and therefore remains strategically under-recognised. The hospital may pay for additional clinical complexity; the patient may lose function; an employer may absorb absence or reduced productivity; a family may provide unpaid care; an education system may finance additional support; and a government may assume disability, rehabilitation or long-term-care obligations. No single ledger records the complete consequence, yet the health system helped determine whether that consequence remained avoidable.
2.1 Four properties of prevention liability
First, prevention liability behaves as both a stock and a flow. New unresolved cases enter the pathway, while cases already present continue to age. A stable total can therefore conceal worsening exposure if the average age, upper-range age or clinical severity of unresolved risk is increasing.
Second, the liability may be non-linear. Before a critical threshold, a relatively contained intervention may preserve substantial function. Beyond it, clinical complexity and downstream support needs can rise sharply while the probability of full recovery falls. This additional health-system burden is described here as the irreversibility premium.
Third, the liability is transferable. It may leave the originating department and reappear in a different service, budget or sector. A missed developmental opportunity can become a long educational and occupational burden; a surveillance failure can reappear as emergency treatment, disability or loss of income; a missed functional window in older age can accelerate dependency and caregiver demand.
Fourth, prevention liability is ethically and economically patterned. Patients with the least capacity to navigate fragmented systems often carry the greatest exposure: people living far from services, families with limited transport or digital access, migrants, people with low health literacy, and communities in which specialist capacity is sparse. Equity is therefore not an additional chapter after efficiency. It is a determinant of how quickly unresolved risk becomes harm.
3. The hidden balance sheet
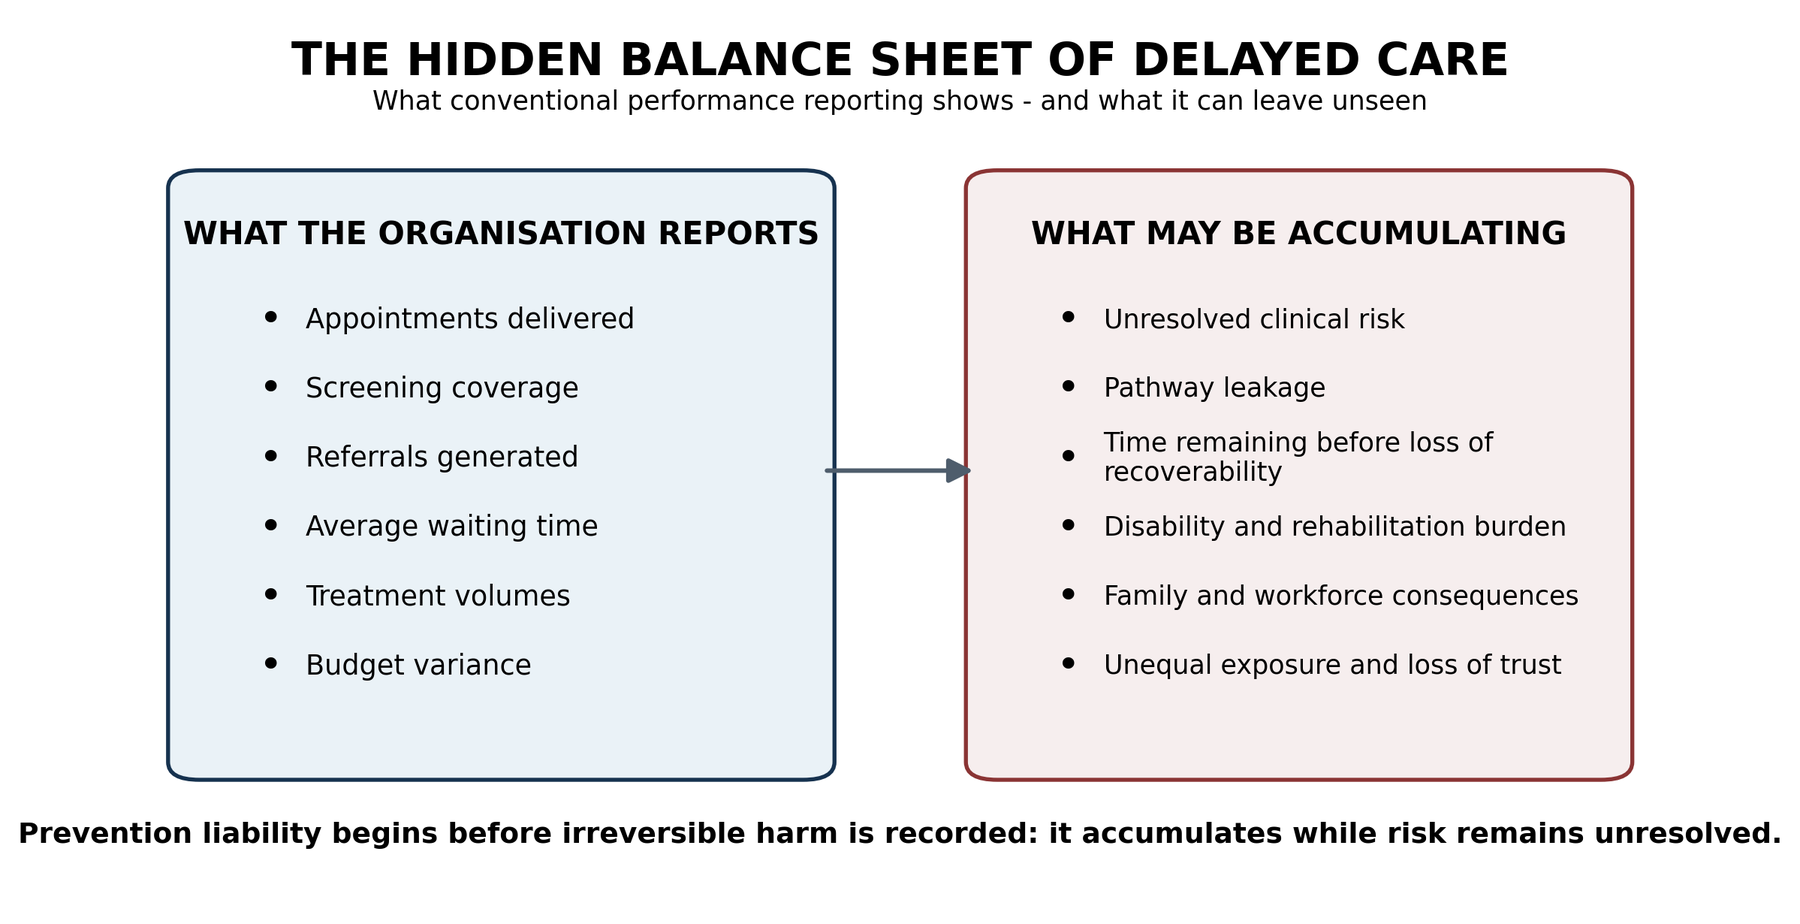
The phrase hidden balance sheet describes a governance problem rather than an accounting technique. Health organisations are highly visible when they purchase equipment, employ staff or exceed an annual budget. They are less consistently able to show the future obligations created by an expiring opportunity for prevention. The consequence is an asymmetry: the cost of acting today is concrete, departmental and immediately scrutinised; the cost of arriving late is dispersed, delayed and frequently borne by another budget or another household.
The global eye-health evidence illustrates the magnitude of this asymmetry. At least 2.2 billion people live with near or distance vision impairment, and at least 1 billion cases could have been prevented or remain unaddressed (WHO, 2026). WHO separately estimates annual productivity losses associated with unaddressed vision impairment at US$410.7 billion in purchasing-power-parity terms and the resource gap for addressing unmet need at US$24.8 billion (WHO, 2023). The juxtaposition is strategically important, but the estimates measure different economic categories and analytical scopes. They show that unresolved functional loss can carry consequences far beyond the service budget; they do not constitute a calculable return on investment.
The same strategic imbalance appears beyond eye care. A World Bank analysis of seven major noncommunicable diseases in the Gulf Cooperation Council estimated direct medical costs of US$16.7 billion in 2019 international dollars, approximately 0.6% of regional GDP. Estimated losses from absenteeism and presenteeism exceeded US$80 billion, or about 2.7% of GDP; type 2 diabetes accounted for approximately US$47.2 billion of the combined burden. These figures do not measure delay and should not be presented as the cost of delayed prevention. They demonstrate why a condition can become economically dominant once clinical burden, workforce participation and service utilisation are considered together. (World Bank, 2023)
In the Caribbean, noncommunicable diseases account for approximately 75% of deaths, with estimated economic effects ranging from 1.36% to 8% of GDP, before some indirect family and productivity costs are fully captured. In Fiji, the annual economic impact of noncommunicable diseases is estimated at about US$260 million (FJD 591 million), and health expenditure could exceed 2.5 times its current real per-capita level by 2050 if current NCD trends continue. These estimates arise from different models and cannot be added or directly compared. Together, they show that downstream disease burden is not an abstract clinical externality; it is a development, labour-force and fiscal issue. (World Bank, 2024a; World Bank, 2024b)
The prevention-liability perspective does not claim that all of these costs were caused by delayed care. It asks a narrower and more actionable question: what proportion of future burden remains modifiable now, and what operational failure would allow that opportunity to expire? That question shifts the executive conversation from general support for prevention to the governance of specific, ageing risks.
4. Clinical-window governance
Clinical-window governance is the organisational discipline of aligning capacity, accountability, escalation and measurement with the period during which an intervention can still preserve life, function or independence. It does not require every pathway to be treated as an emergency. It requires leaders to recognise that time has different clinical meanings and to design governance accordingly.
4.1 Four types of window
A critical window can close rapidly and may require immediate or tightly time-bounded action. A developmental window narrows as a biological system matures, so an apparently modest delay can reduce the eventual quality of recovery. A surveillance window depends on repeated observation and escalation before asymptomatic disease crosses into irreversible damage. A functional-independence window concerns conditions in which delayed recognition or discontinuity may accelerate loss of mobility, autonomy, communication or participation. These categories overlap; their value is managerial, not taxonomic.
4.2 Six requirements of clinical-window governance
• Define the clock start. A pathway must state which event activates time-sensitive responsibility: a risk trigger, abnormal result, referral, diagnosis or treatment decision.
• Specify the clinically meaningful control point. The target should reflect the action that protects the patient, not merely the first administrative contact.
• Assign one end-to-end owner. Handoffs can distribute work, but they must not dissolve accountability.
• Use escalation before the threshold. Alerts should activate while recovery remains possible, not after a breach becomes visible in retrospective audit.
• Close the feedback loop. The referring team, receiving service and patient should know whether the required action occurred and what follows next.
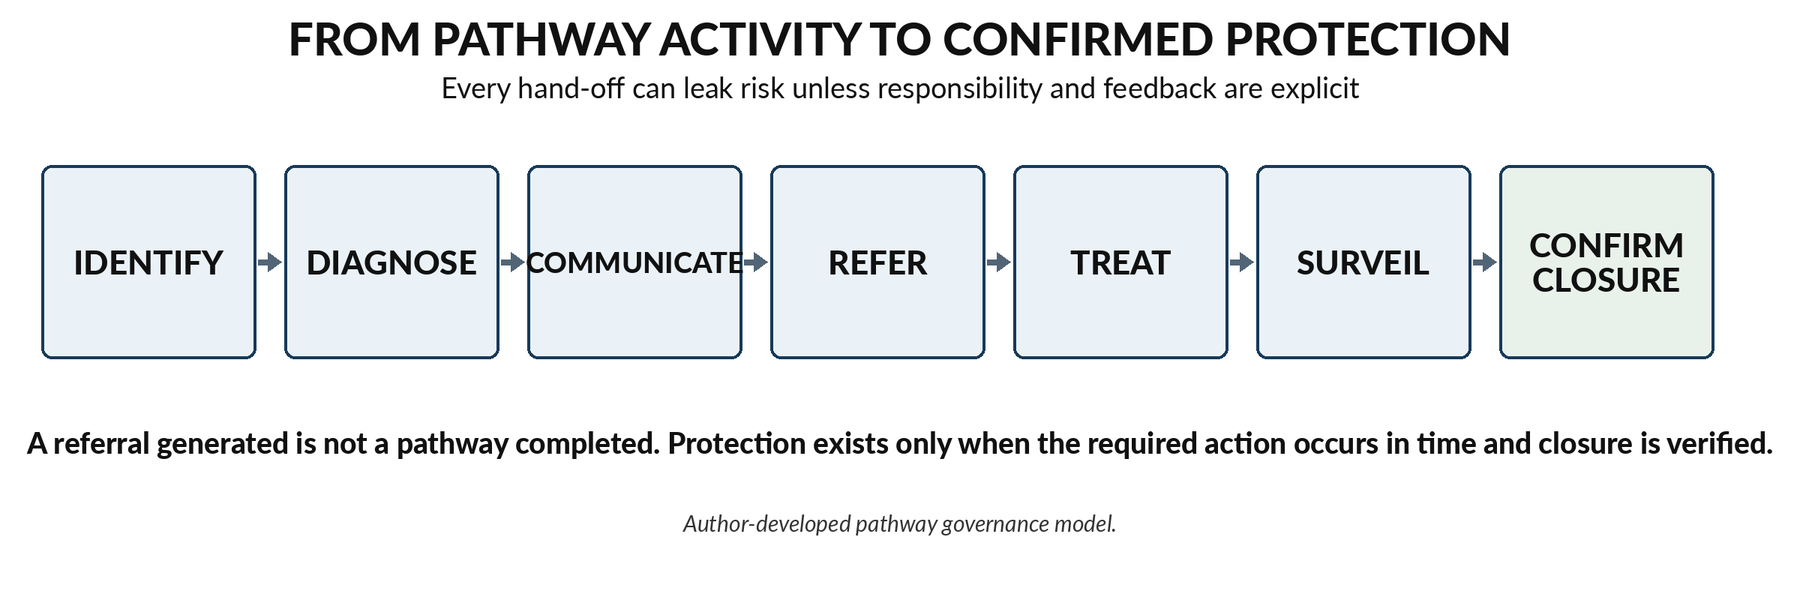
• Verify protection. Completion means that the clinically required step happened in time and that continuity or outcome has been confirmed where appropriate.
WHO guidance on integrated service organisation emphasises coherent pathways, timely acute care, effective referral and counter-referral, and longitudinal coordination. The prevention-liability framework adds a governance lens to those principles: it asks whether every handoff preserves the remaining clinical window and whether leaders can see unresolved risk before the patient crosses an irreversible threshold. (WHO, service organisation)
5. When delay becomes mortality, disability or lost function
The case for clinical-window governance rests on a clinical reality: delay can interact with disease progression in ways that alter outcome. WHO reports that diagnostic errors – including missed, incorrect, delayed and poorly communicated diagnoses – account for approximately 16% of preventable patient harm. Such errors can prolong illness, increase cost, cause disability and contribute to death. The statistic covers several forms of diagnostic failure; it should not be interpreted as a delay-only proportion. (WHO, 2024)
In a systematic review and meta-analysis involving 1,272,681 patients across 34 studies and 17 treatment indications, each four-week delay in cancer surgery was associated with a 6-8% increase in mortality risk, with significant associations reported for 13 of the 17 indications examined (Hanna et al., 2020). The evidence is observational. Although the review prioritised adjusted, higher-validity estimates, residual confounding by disease characteristics, comorbidity, treatment readiness and clinical prioritisation cannot be excluded; rapidly progressive or advanced cases may also be prioritised for earlier treatment. The findings should therefore inform pathway urgency and population-level planning, not be interpreted as an identical causal effect for every cancer or individual patient.
The African Region provides another perspective on preventable time-sensitive harm. Maternal mortality fell by 40% between 2000 and 2023, yet the region still accounted for approximately 70% of global maternal deaths; about 178,000 mothers and one million newborns die each year, many from causes that are preventable or treatable with timely, high-quality care. Not every death is attributable to delay, and the pathways are shaped by access, workforce, transport, quality and broader social conditions. The lesson is that timeliness cannot be separated from system design. (WHO Africa, 2025)
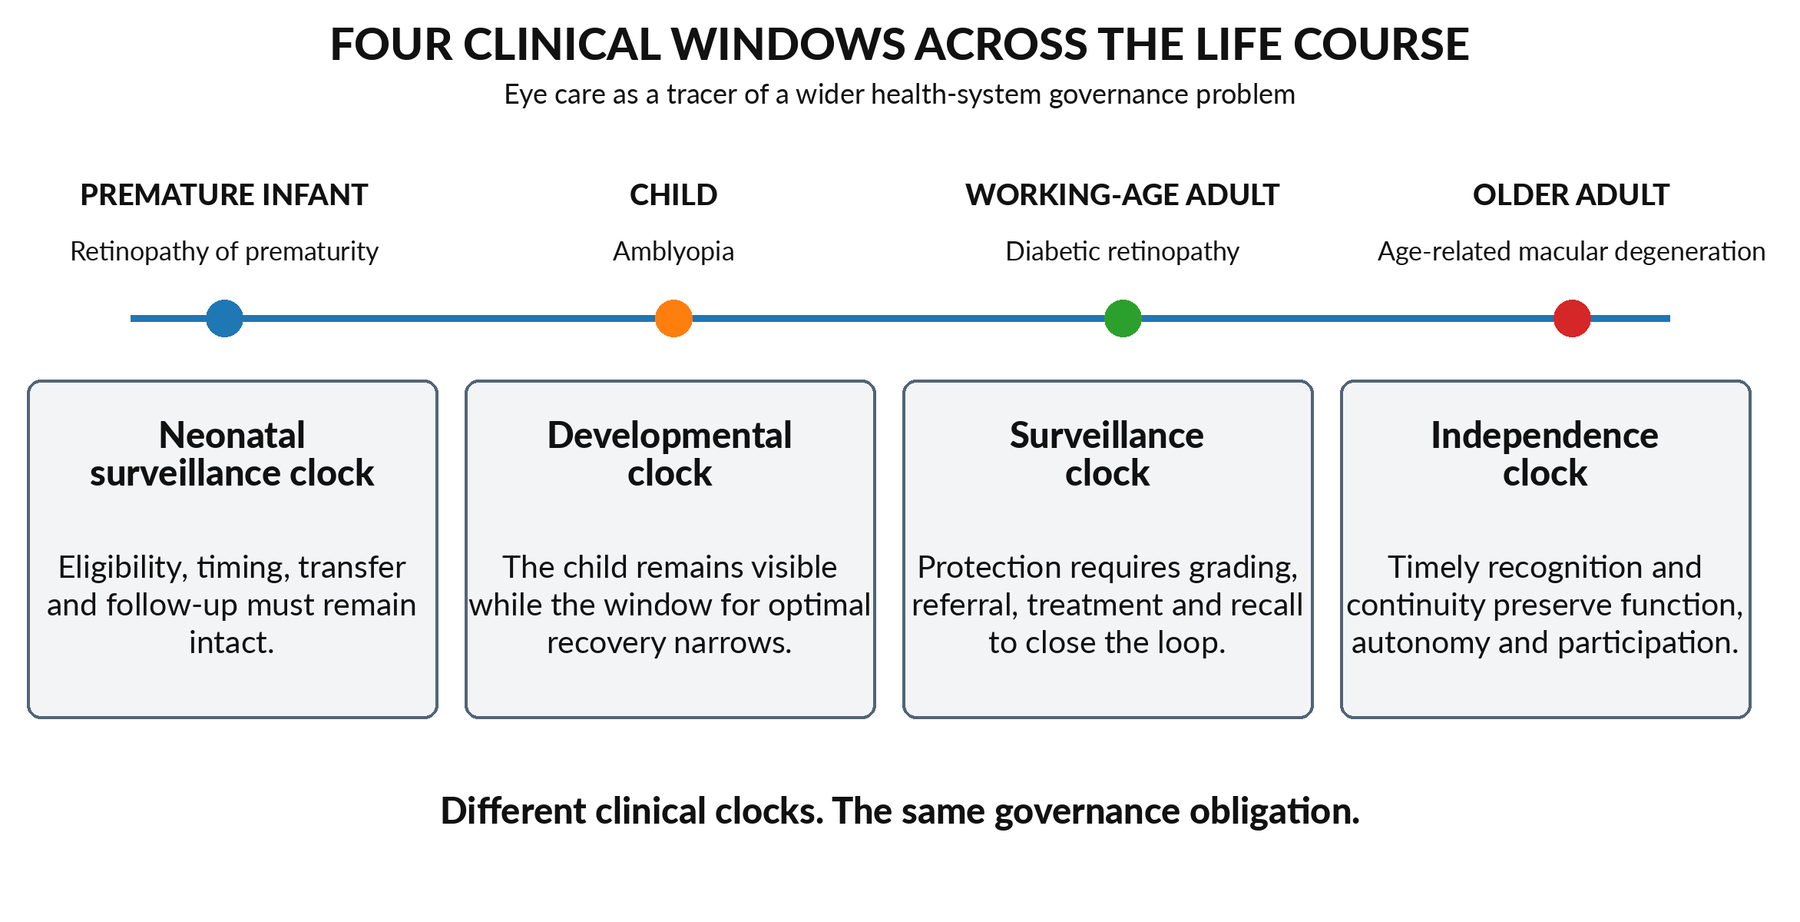
6. Four clinical windows across the life course
Eye care offers an unusually clear life-course lens through which to examine prevention liability. The four tracer conditions used here do not confine the argument to ophthalmology; they reveal, with unusual clarity, how timing, surveillance, continuity and irreversible loss interact. Together, they show how a common governance failure can take different forms from neonatal care to older age.
6.1 Retinopathy of prematurity: the neonatal surveillance clock
Retinopathy of prematurity (ROP) sits at the intersection of neonatal survival, screening governance and specialised treatment. A Global Burden of Disease–based analysis covering 204 countries and territories reported a total of approximately 8.79 million ROP-related visual-loss cases across the 1990–2021 dataset. This is an aggregate across annual estimates over three decades, not an annual incidence or a count of 8.79 million contemporaneous patients. The burden remains concentrated in lower-development settings while the pattern is shifting as neonatal survival improves in countries whose screening systems may not mature at the same pace. (Wong et al., 2026)
The management insight is the survival-vision paradox: a health system can invest heavily and successfully in neonatal survival while failing to protect the vision of the infant who survives. Eligibility criteria, the timing of examinations, transfers between facilities, documentation, family communication, specialist availability and post-discharge follow-up form one safety chain. The prevention liability emerges not from one dramatic failure alone, but from any unresolved break in that chain while retinal disease remains time sensitive.
A neonatal programme should not regard survival and vision protection as separate achievements. They are consecutive obligations within the same outcome pathway.
6.2 Amblyopia: the developmental clock
Amblyopia illustrates a different form of expiring opportunity. A systematic review estimated that 99.2 million people were living with amblyopia in 2019 and projected approximately 175.2 million by 2030 and 221.9 million by 2040. The uncertainty intervals are wide, particularly for future projections, and should remain visible in any detailed epidemiological use of the figures. (Fu et al., 2020)
The strategic problem is that the child may remain present in the health system while the developmental opportunity for optimal visual recovery progressively narrows. A screening encounter can therefore produce a reassuring activity count without delivering protection. Identification must lead to confirmation, optical correction where indicated, activation of treatment, adherence support and continued monitoring. The relevant failure is not merely non-attendance. It is the absence of a pathway capable of converting early detection into sustained developmental benefit.
In developmental care, the patient may not disappear. The recoverable opportunity can.
6.3 Diabetic retinopathy: the surveillance clock
Diabetic retinopathy makes the distinction between contact and closure particularly visible. Global modelling estimated that 103.12 million adults had diabetic retinopathy in 2020, projected to rise to 160.50 million by 2045. Vision-threatening disease was projected to increase from 28.54 million to 44.82 million. The Middle East and North Africa was projected to experience the largest relative increase, approximately 96.3%, between 2020 and 2045. (Teo et al., 2021)
The managerial risk lies in equating a screening event with a protected patient. The image may be taken but not gradable; graded but not communicated; communicated but not referred; referred but not attended; treated but then lost from surveillance. Each completed administrative step can coexist with unresolved clinical risk. Effective governance therefore requires a longitudinal denominator: not only who was screened, but who remains unresolved, for how long, at what risk level, and under whose ownership.
WHO estimates that diabetic retinopathy accounts for approximately 3.9 million people within the global burden of preventable or unaddressed distance vision impairment, and emphasises early detection and timely treatment to prevent irreversible loss. The strategic implication is precise: coverage measures contact; prevention-liability reporting measures the risk that remains after contact. (WHO, 2026)
6.4 Age-related macular degeneration: the independence clock
Age-related macular degeneration (AMD) illustrates why clinical outcomes and social independence cannot be separated. A major meta-analysis estimated approximately 196 million people with AMD in 2020, projected to rise to 288 million by 2040, with substantial uncertainty around both estimates. (Wong et al., 2014)
WHO estimates that AMD accounts for approximately 8 million people within the preventable or unaddressed burden of distance vision impairment. Vision impairment in older adults is associated with social isolation, difficulty walking, increased falls and fractures, and earlier entry into care or nursing facilities. These associations are not attributable to AMD alone, and individual outcomes vary. They nevertheless show why an ageing strategy that counts years of life but does not protect function is incomplete. (WHO, 2026)
Population ageing is not only a demand forecast for beds and clinics. It is a governance test of whether health systems preserve the functions that make longer life independent.
7. Global evidence ledger
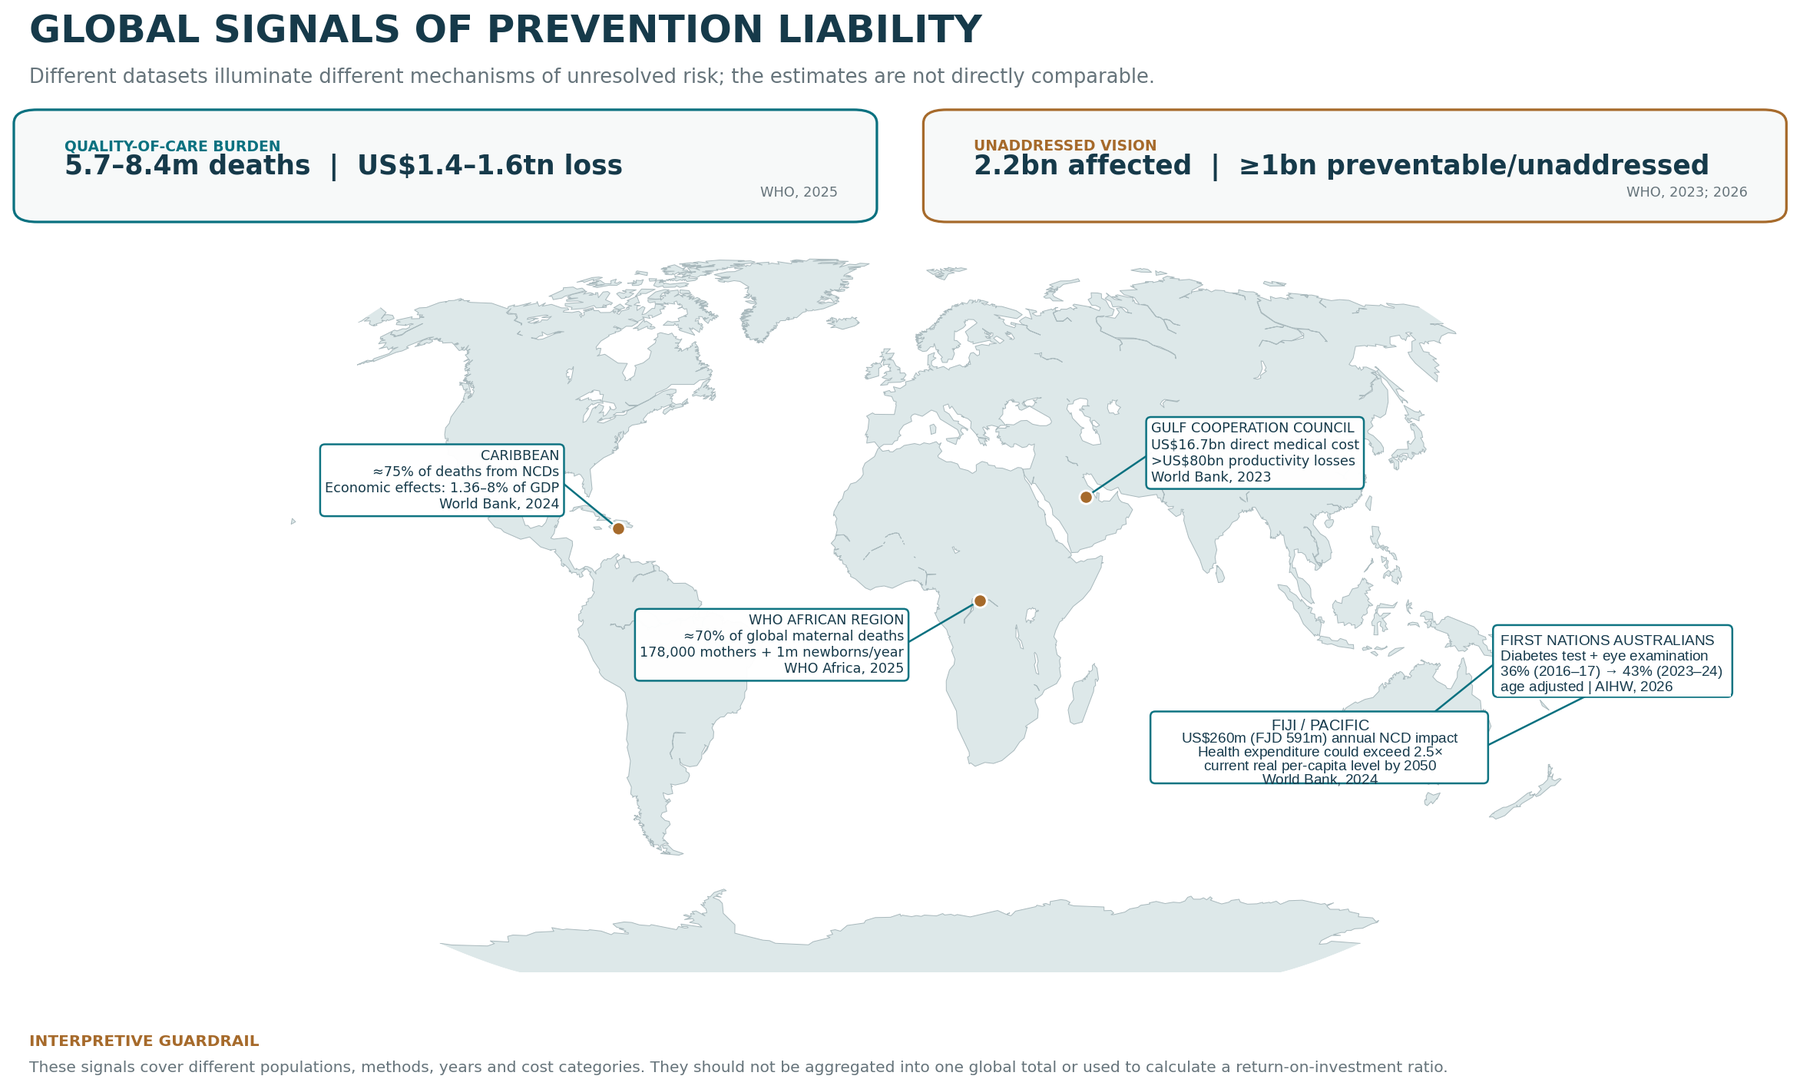
Geographical breadth is useful only when it reveals different mechanisms of prevention liability. The evidence below is presented with explicit interpretive guardrails; it is neither a league table nor a basis for direct comparison of monetary values across methods, years or jurisdictions.
| Geography / system | Anchor evidence | Source and year | Executive meaning | Interpretive guardrail |
|---|---|---|---|---|
| Low- and middle-income countries | 5.7-8.4 million deaths annually attributed to poor-quality care; US$1.4-1.6 trillion in annual productivity losses. | WHO, 2025 | Quality and timeliness are macroeconomic as well as clinical issues. | Broad quality estimate; not all burden is caused by delay. |
| Global vision | At least 2.2 billion people with vision impairment; at least 1 billion preventable or unaddressed; US$410.7 billion annual productivity loss (PPP); US$24.8 billion estimated resource gap. | WHO, 2023; 2026 | Unresolved functional loss carries a global labour-force and development burden. | Different methods and scopes; the US$410.7 billion and US$24.8 billion estimates are not an ROI pair. |
| Gulf Cooperation Council | Seven major NCDs: US$16.7 billion direct medical cost and more than US$80 billion absenteeism/presenteeism losses in 2019 international dollars. | World Bank, 2023 | Clinical burden is magnified when workforce effects are included. | Seven diseases only; broad NCD burden, not delayed eye-care cost. |
| Caribbean | NCDs account for about 75% of deaths; estimated economic effects of 1.36-8% of GDP. | World Bank, 2024a | Prevention and continuity are development and fiscal priorities for small states. | Range reflects heterogeneous studies; some indirect costs remain excluded. |
| Pacific island countries | Fiji NCD burden about US$260 million (FJD 591 million) annually; health expenditure could exceed 2.5 times its current real per-capita level by 2050 if current trends continue. | World Bank, 2024b | Small populations can face very large proportional burdens and high delivery costs. | Broad NCD impact and expenditure projection; not a delay-specific estimate or a forecast of cash savings. |
| WHO African Region | About 178,000 maternal and one million newborn deaths annually; many causes preventable or treatable with timely, quality care. | WHO Africa, 2025 | Timeliness depends on access, transport, workforce, referral and quality as one system. | Do not attribute all deaths to delay or a single pathway failure. |
| First Nations Australians | Among people tested for diabetes, age-adjusted documented eye examination rose from 36% in 2016-17 to 43% in 2023-24. | AIHW, 2026 | Progress and residual exposure must be viewed together. | Administrative measure of diabetes testing plus eye examination; not proof of diabetic-retinopathy screening, completed treatment or outcomes. |
| Cancer treatment pathways | Across 1,272,681 patients, surgical indications showed a 6–8% increase in mortality risk associated with each four-week delay. | Hanna et al., 2020 | Calendar time can have measurable clinical meaning. | Observational evidence across selected cancers and treatments; residual confounding remains possible; not a universal causal rule. |
Table 1. Global Evidence Ledger. Sources are reproduced in the reference list. Values are intentionally accompanied by interpretive limits to prevent false comparison or causal overstatement.
8. Why dashboards can report success while risk accumulates
Performance systems frequently measure the front of a pathway more effectively than its end. A programme can report high invitation rates while attendance remains unequal; high screening coverage while abnormal findings remain unresolved; rapid referral while treatment is delayed; or successful treatment while surveillance continuity is lost. None of the initial measures is unimportant. The governance error is treating them as interchangeable with the final outcome the pathway was created to protect.
WHO’s eye-care targets use the concept of effective coverage, which combines service use with a level of quality sufficient to produce intended benefit. That distinction is strategically important. Contact coverage asks whether a person reached a service. Effective coverage asks whether the service delivered the intended correction or outcome. Prevention-liability reporting adds time and closure: did the effective action occur before recoverability was materially reduced, and does the organisation have evidence that no unresolved risk remains? (WHO, 2022)
The ladder prevents a common reporting error: using a proxy from an early stage as proof of a later outcome. It also exposes where denominators change. The number screened is not the number with a valid result; the number referred is not the number treated; the number treated is not the number safely retained in surveillance. A prevention-liability view keeps the unresolved denominator visible throughout.
9. The Prevention Liability Register
The proposed Prevention Liability Register converts the concept into a board-level view of unresolved time-sensitive risk. It is not designed to monetise every patient or create a punitive reporting layer. Its purpose is to show which populations are approaching loss of recoverability, why they remain unresolved, who owns the next action and what must happen before risk matures into harm.
The register should begin with a small number of pathways selected because they combine significant harm, meaningful time sensitivity, recurrent leakage and executive relevance. Initial implementation can be clinically rated rather than monetised. The illustrative register deliberately places suspected cancer and high-risk maternity alongside eye-care pathways to test generalisability: prevention liability is a health-system governance construct, not an ophthalmology-specific performance model.
9.1 Illustrative register structure
| Pathway | At-risk cohort | Clock start | Clinical control point | Unresolved risk / age | Likely leakage point | Equity marker | Named owner | Escalation / closure evidence |
|---|---|---|---|---|---|---|---|---|
| Suspected cancer | People meeting locally defined urgent criteria | Qualifying referral or diagnostic trigger | Pathway-specific diagnosis/treatment milestone | Count by risk band and time elapsed | Diagnostics, multidisciplinary review or treatment capacity | Geography, deprivation, language, transport | Named pathway executive and clinical lead | Pre-threshold escalation; verified treatment/transfer |
| High-risk preterm infant | Infants meeting current national/local ROP criteria | Eligibility confirmed or transfer received | Programme-defined examination/treatment milestone | Due, overdue and transferred without confirmed follow-up | Eligibility capture, transfer, specialist access, discharge | Distance, neonatal transfer, family communication | NICU-retina pathway owner | Senior escalation; completed examination/treatment and recall |
| Diabetic eye surveillance | People due for screening or follow-up | Due date, abnormal result or failed image | Gradable result and risk-appropriate action | Unscreened, ungradable, abnormal unresolved, lost to recall | Invitation, grading, communication, referral, treatment | Digital access, language, mobility, remote location | Population eye-health pathway owner | Risk-stratified escalation; confirmed disposition |
| High-risk maternity pathway | Women with locally defined high-risk features | Risk identification or clinical deterioration | Pathway-specific assessment/intervention | Unresolved triggers and transfer delays | Recognition, transport, referral acceptance, capacity | Distance, poverty, age, migrant status | Maternity network owner | Early warning escalation; handover and outcome confirmation |
| Time-sensitive retinal symptoms | Patients meeting local urgent referral criteria | Symptom disclosure or clinical suspicion | Specialist assessment and indicated treatment | Awaiting triage, assessment or treatment by urgency | Public awareness, referral triage, appointment capacity | Age, transport, caregiver support, health literacy | Urgent retina pathway owner | Threshold-based escalation; documented treatment/plan |
Table 2. Prevention Liability Register – illustrative structure. Clinical thresholds, escalation rules and ownership must be locally validated. No example row should be implemented as a guideline without pathway-specific clinical review.
9.2 Minimum pilot data set
A pilot requires a minimum information architecture that can be populated from existing clinical systems before new bureaucracy is created. Data definitions should be pathway-specific, clinically validated and auditable.
| Data element | Operational definition | Proposed minimum data source | Validation requirement |
|---|---|---|---|
| Patient/pathway identifier | Locally approved identifier enabling end-to-end reconciliation without unnecessary duplication. | EMR, pathway registry or referral platform. | Missing and duplicate identifier check. |
| Clock-start date and time | Date/time of the validated clinical trigger that activates pathway responsibility. | Referral, diagnostic report, screening result, admission record or clinical assessment. | Sample review against the source document. |
| Clinical control point | The action or milestone that preserves the relevant opportunity; not merely first administrative contact. | Approved pathway protocol or current clinical guidance. | Clinical lead and governance approval. |
| Current pathway status | Awaiting, accepted, scheduled, completed, transferred, declined, lost or clinically closed. | EMR, worklist, referral platform or receiving-service acknowledgement. | Periodic reconciliation across systems. |
| Age of unresolved risk | Elapsed time from the validated clock start, displayed as a distribution rather than only an average. | System-calculated field. | Date-logic and outlier testing. |
| Risk band / remaining window | Locally validated urgency and pre-threshold warning band. | Clinical assessment, diagnostic report or pathway rule. | Specialist audit; no historical percentile may normalise unsafe performance. |
| Named current owner | Person or service with authority for the next action and escalation. | Workflow assignment or responsible-service field. | Escalation simulation and ownership audit. |
| Equity signal | Locally justified variables that may alter access or consume clinical opportunity. | Registration, geography, language, disability, transport or social data. | Privacy, proportionality and completeness review. |
| Closure evidence | Verified completion, transfer, treatment, surveillance plan or documented clinical disposition. | EMR entry, operative report, result, receiving-service confirmation or patient communication record. | Closed-loop sample audit. |
Table 3. Minimum Pilot Data Set for a Prevention Liability Register. Fields must be locally defined, privacy-proportionate and clinically validated before use.
9.3 How the register should operate
The register should be reviewed at a cadence proportionate to the shortest clinical windows it contains. A quarterly board review may be adequate for trend and accountability, but it cannot substitute for daily or real-time operational escalation in pathways where risk changes rapidly. Executive oversight and frontline control are complementary layers, not competing processes.
Each pathway should define a clock start, a clinically meaningful threshold, pre-threshold warning bands, an end-to-end owner, and acceptable evidence of closure. Red and amber categories should be based on clinical risk rather than public-relations sensitivity. The register should make both volume and age visible: ten recently unresolved cases may represent a different exposure from ten cases approaching the edge of recoverability.
Equity should be embedded at record design, not added retrospectively. Stratification by geography, socioeconomic position, disability, language, migration status or other locally relevant factors can identify groups whose clinical windows are disproportionately consumed by travel, communication failure or fragmented access. The objective is not to label communities as non-compliant; it is to reveal where pathway design transfers navigation burden to people least able to carry it.
Finally, the register must be learning oriented. A crossed threshold should trigger a proportionate review of system conditions – demand, capacity, referral quality, data flow, communication, handoffs, family support and escalation – rather than an automatic disciplinary response. Review intensity should reflect severity, recurrence and learning potential. Concerns about deliberate unsafe or reckless conduct remain subject to established professional and organisational processes; Just Culture is not the absence of accountability, but the discipline of locating accountability fairly. (WHO, 2020; NHS England, 2023)
9.4 Capacity-constrained settings: visibility before judgement
In severely capacity-constrained settings, prevention liability should not be interpreted solely as evidence of pathway underperformance. The register may function primarily as a triage, planning and strategic advocacy instrument. Where specialist workforce, diagnostics, transport or treatment capacity is genuinely unavailable, leadership’s responsibility is to quantify exposed populations, make scarcity visible, establish ethical prioritisation, develop regional or cross-border arrangements where feasible, and build the case for workforce, capital or policy investment. Visibility must precede judgement: the purpose is not to blame teams for resources they do not possess, but to prevent scarcity from remaining invisible until harm becomes irreversible.
10. Seven questions every board should answer
11. Executive actions: from awareness to governance
11.1 Classify pathways by clinical-window sensitivity
Waiting lists should be stratified by the relationship between time and outcome, not solely by specialty, referral category or chronological order. Leaders should identify which pathways contain hard thresholds, progressive loss of benefit, surveillance-dependent risk or threats to functional independence. This classification should be clinically led and periodically reviewed as evidence and treatment options evolve.
11.2 Name end-to-end accountability
Complex care requires distributed expertise, but distributed expertise must not become distributed non-ownership. Each priority pathway should have a named executive owner and clinical lead accountable for the full sequence, including transfers, rejected referrals, failed communication, non-attendance, capacity escalation and evidence of closure. Ownership is not personal blame; it is the authority to see and correct the system.
11.3 Replace breach reporting with pre-threshold escalation
A report generated after the patient has crossed a clinically important threshold is an audit of lost opportunity. Systems should define warning points sufficiently early to create a realistic chance of recovery: additional capacity, alternative providers, transport support, senior review, direct communication or transfer of responsibility. Escalation must be designed around the patient’s remaining window, not the convenience of a monthly reporting cycle.
11.4 Measure closure, not referral production
A referral is an intention. It becomes protection only when the receiving pathway accepts responsibility, performs the required action and confirms the next state. Closed-loop referral standards should include acknowledgement, triage, communication of non-acceptance, contingency arrangements, and feedback to the originating team. A system that cannot trace a patient across organisational boundaries cannot reliably govern prevention liability.
11.5 Integrate clinical, economic and social intelligence
Clinical leaders see severity; finance teams see expenditure; human-resources teams see absence; families see caregiving; social systems see disability and dependency. Prevention liability becomes visible only when these perspectives are connected. The objective is not to produce one seductive total cost, but to understand how the consequences of unresolved risk migrate across institutional and social ledgers.
11.6 Make inequity operationally visible
Equity should be measured as differential loss of clinical opportunity. A pathway may offer identical appointment rules while imposing unequal travel, digital, linguistic or caregiving burdens. Leaders should ask which populations enter later, wait longer, experience more failed contacts, or are more likely to leave the pathway without confirmed closure. Corrective design may require outreach, transport, interpreters, decentralised services or different communication channels rather than repeated generic reminders.
11.7 Learn from every crossed threshold
Cases in which recoverability was materially reduced should be treated as system-learning events. Review should examine not only whether a guideline was followed, but whether capacity, data, communication, escalation and accountability made timely action realistically achievable. The purpose is to identify repeatable mechanisms of failure and redesign them before they create the next liability.
The prevention agenda becomes operational only when leaders can identify the risk, see the clock, name the owner, activate escalation and verify closure.
12. From concept to policy adoption
Prevention liability should not be adopted as a mature metric before it is tested. The most credible route is a deliberately small 90-day pilot in one high-risk pathway. The pilot should test whether earlier visibility changes action, whether the data are trustworthy, whether staff burden is proportionate, and whether escalation improves pathway closure without creating inequitable displacement or alert fatigue.
Economic analysis should distinguish value, cost avoidance and cash-releasing savings; they are not synonyms. Earlier detection may improve outcomes and reduce future burden while increasing near-term service use by identifying previously unmet need. Any model should use ranges and scenario analysis, separate direct medical expenditure from productivity, unpaid care and social-service costs, identify the price year and currency, and disclose whether estimates are observed, modelled or transferred from another jurisdiction. Where evidence is weak, the correct output is uncertainty, not invented precision.
Policy adoption would also require safeguards. A prevention-liability measure could create perverse incentives if organisations avoid high-risk patients, manipulate clock starts, over-prioritise easily measured pathways or treat a warning signal as proof of preventable harm. Independent clinical validation, transparent definitions, auditability, patient involvement, information-governance controls and an approved Just Culture charter are therefore essential. The framework should support earlier protection, not become another target that can be met while its purpose is lost.
12.1 A 90-day pilot method
| DAYS 1-30 Define and govern |
DAYS 31-60 Establish the baseline |
DAYS 61-90 Test active escalation |
|---|---|---|
| • Select one high-risk pathway. • Define the clock start, clinical control point and closure evidence. • Approve the Just Culture and information-governance charter. • Name the executive owner, clinical lead and escalation authority. |
• Measure the number and age distribution of unresolved cases. • Validate data against a clinical-record sample. • Identify recurrent leakage points and equity effects. • Set a clinically justified pre-threshold warning point; historical percentiles must not normalise unsafe practice. |
• Activate pre-threshold escalation. • Record actions, timely closures and unresolved capacity constraints. • Measure false alerts, staff workload, displacement and equity effects. • Report findings and unintended consequences to the board. |
13. Conclusion: govern the window, not merely the queue
The most expensive patient in healthcare is not always the patient with the most complex disease. It may be the patient whose manageable risk was allowed to mature into irreversible harm while responsibility remained fragmented across the pathway. By the time that harm appears in expenditure, disability, workforce loss, family caregiving or public dissatisfaction, the original prevention opportunity may be difficult to reconstruct and impossible to recover.
This is why delayed care requires a richer executive language. Waiting time describes an interval. Prevention liability describes what may be accumulating within it. The irreversibility premium explains why consequences can rise sharply after a clinical window narrows. Clinical-window governance defines the organisational discipline required to identify risk, preserve time, assign ownership and act before the opportunity is lost.
This analysis does not suggest that every delay is dangerous, every adverse outcome preventable or every downstream burden attributable to one institution. It issues a more precise professional alert: conventional dashboards may report activity, coverage and throughput while recoverable health continues to expire beyond their field of view. Ministers, boards, regulators and pathway leaders should therefore ask not only how many patients entered a service, but how many remained unresolved, how long their risk had aged, who owned the next action and what evidence confirmed protection.
Health systems should stop measuring only how many people they screened, referred or treated. They must also measure how much recoverable health is being lost while nobody owns the clock.
Prevention is not merely an intervention delivered today. It is a liability avoided tomorrow. The responsibility of leadership is to make that avoided liability visible early enough to act.
Methods and evidential discipline
This policy and practice analysis used a structured critical review and interpretive synthesis of WHO publications, World Bank reports, regional and national government sources, official patient-safety guidance and major peer-reviewed systematic reviews relevant to quality, timeliness, economic burden and the four tracer eye conditions. It was designed to construct and stress-test an executive management argument rather than estimate a pooled causal effect. Sources were selected for authority, relevance, geographic diversity and interpretive usefulness. Major figures are accompanied by the source and year in the text and by full references below.
Each numerical claim was checked for population, geography, timeframe, denominator, currency basis, price year where available, direct or indirect cost category, and observed or modelled status. Monetary estimates from different studies are not aggregated. Associations are not described as causal effects unless the source supports that interpretation. Projections retain their status as projections, and important uncertainty is stated. The integrated Prevention Liability framework, its health-system use of an irreversibility premium, the Clinical-Window Governance model, Pathway Assurance Ladder and Prevention Liability Register are author-developed within this analysis and require empirical validation before formal performance use. This statement concerns the integrated health-system application; it does not assert that every component phrase is unprecedented across other disciplines.
This is not a systematic review, clinical guideline, legal opinion or accounting standard. It does not define pathway-specific treatment deadlines. Any operational application must use current national or local clinical guidance, validated thresholds, information-governance safeguards and specialist review. Evidence and source pages were current when checked on 28 July 2026.
References
- World Health Organization. Quality health services. Fact sheet. 19 May 2025.
- World Health Organization. World Patient Safety Day 2024: Improving diagnosis for patient safety. 2024.
- Hanna TP, King WD, Thibodeau S, et al. Mortality due to cancer treatment delay: systematic review and meta-analysis. BMJ. 2020;371:m4087.
- World Health Organization. Blindness and vision impairment. Fact sheet. 10 February 2026.
- World Bank. Gulf Economic Update: The Health and Economic Burden of Non-Communicable Diseases in the GCC. 2023.
- World Bank. The Economic Impact of Non-Communicable Diseases in the Caribbean. 5 April 2024.
- World Bank. Fiji Health Sector Review: Mo Bulabula, ka Bula Balavu. Washington, DC: World Bank; 2024.
- World Health Organization Regional Office for Africa. African Region’s maternal and newborn mortality declining, but progress still slow. 7 April 2025.
- Australian Institute of Health and Welfare. Eye health measures for First Nations people 2025: In brief. Released 19 February 2026.
- Wong ES, Choy RW, Zhang Y, et al. Global and Regional Trends in Retinopathy of Prematurity. JAMA Ophthalmology. 2026;144(2):139-147.
- Fu Z, Hong H, Su Z, Lou B, Pan CW, Liu H. Global prevalence of amblyopia and disease burden projections through 2040: a systematic review and meta-analysis. British Journal of Ophthalmology. 2020;104(8):1164-1170.
- Teo ZL, Tham YC, Yu M, et al. Global prevalence of diabetic retinopathy and projection of burden through 2045: systematic review and meta-analysis. Ophthalmology. 2021;128(11):1580-1591.
- Wong WL, Su X, Li X, et al. Global prevalence of age-related macular degeneration and disease burden projection for 2020 and 2040: systematic review and meta-analysis. The Lancet Global Health. 2014;2(2):e106-e116.
- World Health Organization. Eye care in health systems: guide for action. Geneva: WHO; 2022.
- World Health Organization. Report of the 2030 targets on effective coverage of eye care. Geneva: WHO; 2022.
- World Health Organization. Services organization and integration: clinical services and systems. Webpage. Accessed 28 July 2026.
- World Health Organization. Increasing eye care interventions to address vision impairment. Technical brief. Geneva: WHO; 2023.
- World Health Organization. Patient safety incident reporting and learning systems: technical report and guidance. Geneva: WHO; 2020.
- NHS England. Improving patient safety culture: a practical guide. 10 July 2023.
Author note
Dr. Samer Al-Diri, MD, MSc, MPH, is a UK-trained ophthalmologist, public-health professional and strategic healthcare consultant. His work spans healthcare management, health-system transformation, clinical governance, prevention, responsible digital health and eye health.
The eye-care examples in this article are used as life-course tracers of wider executive and policy challenges in prevention, continuity and accountability.
© 2026 Dr. Samer Al-Diri. This work is licensed under the Creative Commons Attribution–NonCommercial–NoDerivatives 4.0 International License (CC BY-NC-ND 4.0).
Access and reuse statement: This article is freely available to read online. It may be copied and shared in unadapted form for non-commercial purposes with appropriate attribution under this licence. For permissions beyond this licence, contact sameraldiri@aol.com.